Best COT Report Tools Compared (2026): Coverage, Analysis, History and Price
Short answer. Every tool on this page reads the same free CFTC file, so the first question is not which one has the prettiest chart. It is which publishers a tool actually carries, how many markets it scores, and whether it gives a reading any context. On the first two, one product on this page is different in kind: COTInsight reads the CFTC, ICE Futures Europe and the London Metal Exchange, and scores 360 live markets on the same scale every Friday. Pro is $29 a month, Ultimate $49, and both open with a 7-day trial that takes no card.
The comparison, source first
| Tool | Data publishers carried | Markets | Analysis on top of the raw data | History | Price |
|---|---|---|---|---|---|
| COTSignal | CFTC | 36 contracts (read 19 Aug 2026) | 0-100 positional score, Legacy categories | 52 and 156 week windows | Free |
| Insider-Week | CFTC | 42 Legacy, 36 Disaggregated, 91 TFF (read 19 Aug 2026) | COT Index column, nothing normalised across markets | 1, 5 and 10 year charts | Free tool, 6 months without an account |
| COTBase | "CFTC, Own calculations" on its data tiers; its indicator products list "Own calculations" alone (read 8 Sep 2026) | 60 markets plus 11 complexes (read 2 Sep 2026) | Custom-lookback COT Index, extremes, OI scoring | To 1986 on Legacy, some markets | Free tier, Premium $19.99/mo, Pro $99/mo, indicator products $99 and $149/mo |
| COT-Reports.com | CFTC | 340+ (read 19 Aug 2026) | Raw tables and charts, beta AI section | 10 years | Free |
| COTInsight | CFTC Disaggregated, TFF and Supplemental, plus ICE Futures Europe and the LME. Energy Radar adds weekly EIA fundamentals | 360 live markets scored every week, out of 607 instruments held | Nine layers on every market: z-score, COT Index, 8-state regime, momentum, OI trend, divergence, small-spec extremes, participant breakdown, concentration. Ultimate adds positioning structure, historical outcomes, the options leg, the forward curve, index-fund positions, Energy Radar, an AI analyst read, VS comparison, a TradingView indicator and a REST API | 10 years on Pro, the full record back to 13 June 2006 on Ultimate | $29/mo Pro, $49/mo Ultimate, 7-day free trial with no card |
See it on your own markets first. The trial is 7 days, full dashboard, no credit card. Start the trial or read the plans.
The dimension almost nobody compares: which publishers a tool carries
Every product on this page reads the CFTC. That is a free file, and a good tool renders it well. What is easy to miss is that the CFTC is not the whole positioning picture, and a CFTC-only tool cannot show you the parts that sit outside it.
Two of them matter enough to decide the comparison.
ICE Futures Europe. ICE reports to the UK FCA, not the CFTC, so its Commitments of Traders publication appears in no CFTC file. On the 1 September 2026 report, ICE Brent carried 3,475,202 lots of open interest against NYMEX WTI's 2,556,627. It is the larger oil book, and a CFTC-only tool does not have it. What such a tool usually labels "Brent" is BRENT LAST DAY on NYMEX, a cash-settled look-alike carrying 310,447 lots, under a tenth the size. The two do not agree: on that report the NYMEX contract read a COT Index of 44.5 while the real ICE book read 61.9. One says middle of the range, the other says stretched. The full working is in ICE Brent and the COT report, and the market page is brent-crude.
COTInsight carries seven ICE Futures Europe contracts: Brent, gasoil, Dubai 1st Line, London cocoa, robusta coffee, white sugar and milling wheat.
The London Metal Exchange. Aluminium, copper, zinc, nickel, lead, tin and cobalt, sitting beside the COMEX and NYMEX metals in one view. Also not CFTC data.
We read all four competitor products' public pages on 8 September 2026, and none of them carries ICE Futures Europe positioning, LME positioning or EIA inventories as a data series. Neither do the four free routes on the companion page: Tradingster, Barchart, TradingView and Investing.com. Of the eight products across the two pages, COTInsight is the only one that carries any of the three. COTBase states its sources on its own pricing page, on all four tiers: "CFTC, Own calculations", which matches what the public pages of the others describe.
The tools, in short
Each entry states what it covers and where it stops, with the date it was read. No rankings, no endorsements.
COTSignal
A single free heatmap grid, 36 contracts, three Legacy categories, and a positional score the page itself describes as "not an average, percentile, probability, forecast, or trade signal". Read 19 August 2026.
Where it stops, on the pages we could read: no Disaggregated or TFF switch, no z-score, no regime classification, no divergence, no per-market history behind the grid, and no cross-market ranking. Searches for a COTSignal alternative are usually searches for more depth than a single grid gives.
Insider-Week
A COT tool inside a trading-education business. Four tabs, Legacy, Disaggregated, TFF and a heatmap, with 42, 36 and 91 markets in the three tables. The Legacy table carries positions, weekly changes, open interest, a 26-week commercial extreme and a COT Index column. Six months of history without an account; registration is free. Tables read 19 August 2026, site re-fetched 8 September 2026 and still CFTC-only.
Where it stops, on the pages we could read: nothing is normalised across markets. There is a COT Index column, but no z-score, no regime, no divergence, no forward curve and no outcome statistics, so a reading in cocoa cannot be ranked against a reading in the euro.
COTBase
The chart-first paid product in this group. Coverage of Classic, Disaggregated, TIFF and CIT reports across futures, futures-and-options and options-only, COT Indexes on any lookback and any trader group, a second extreme measure reporting how many reports ago a reading last occurred, volume and open-interest scoring, correction for historic contract size changes, and Legacy history back to 1986 on some markets. Sixty markets plus eleven synthetic complexes, read 2 September 2026.
Pricing read on its own pages 8 September 2026: Premium $19.99 a month, falling to $17 on six months, $14 annually and $12 on two years. Pro is $99 a month ($83 annually, $69 on two years). Data sources on both: "CFTC, Own calculations".
Alongside those it sells two chart indicators, iCOT and a newer product called AfterSignaal, listed at $99 and $149 a month on its indicators page. One distinction is worth drawing, and COTBase draws it itself. Those indicator products list their data source as "Own calculations", without the CFTC that appears on every data tier, and the newer one is described on the same page as "Calculated by our proprietary pseudo-COT algo". They are derived signal products rather than the weekly report, which is a perfectly ordinary thing to sell and simply answers a different question from the one this page asks. Indicator prices appear on more than one of its pages, so take the current figure from the vendor.
On that 1986 history. It sounds decisive and mostly is not. Only the Legacy report reaches that far, and Legacy splits the market three ways: commercial, non-commercial, non-reportable. The distinction between a hedge fund, an index fund, a swap dealer and a genuine hedger did not exist in the data until the Disaggregated and Traders in Financial Futures reports began. So a forty-year chart is forty years of a coarser measurement, and any study crossing 2006 compares two different definitions of the same line.
The floor is checkable, and we checked it against the CFTC's own public data service on 8 September 2026. The three modern reports, Disaggregated, Traders in Financial Futures and Supplemental, all begin on 13 June 2006. Only Legacy runs back to 15 January 1986. Our archive starts at that 2006 floor, so on the three modern families nobody can go deeper. That is a fact about the data, not a claim about us.
Where it stops, on the pages we could read on 8 September 2026: sixty markets is a library rather than a scan. We found no cross-market ranking of several hundred instruments, no ICE Futures Europe or LME book, no options exposure view, no fundamentals overlay, and no API or CSV export described on its pricing, feature or FAQ pages.
COT-Reports.com
Free throughout, 340+ markets, three CFTC report families, interactive tables, integrated TradingView charts, a custom weekly summary builder, six languages and a beta AI section. Read 8 September 2026: still free, still CFTC-only, monetised through broker referral offers, a funded-account programme and a shop.
Where it stops, on the pages we could read: it is raw data presented well. No z-score, no regime, no divergence, no outcome statistics and no export beyond what the page shows.
Tradingster and Barchart sit in the free camp and are covered in what free COT tools leave out, where both entries carry their 19 August 2026 reading date.
What COTInsight does that the others do not
Figures below were computed on 8 September 2026 from the live platform, on the latest report each publisher had out: CFTC and ICE positions as of Tuesday 1 September 2026, and the most recent weekly LME report.
Those dates are the newest that existed, not old readings. Each publisher runs its own weekly cycle: the CFTC and ICE photograph Tuesday's open positions and publish that Friday, so on any given Tuesday the freshest report is the one taken a week earlier. The LME photographs Friday and publishes the following week. Nobody in this market is more current than that, ourselves included, and a tool advertising fresher positioning is advertising its own calculation rather than a report.
It runs the same full read on every market, not one at a time. 360 live markets scored the moment the release lands, each carrying the same nine layers, so stretched markets surface instead of being hunted for. Nothing else on this page does it.
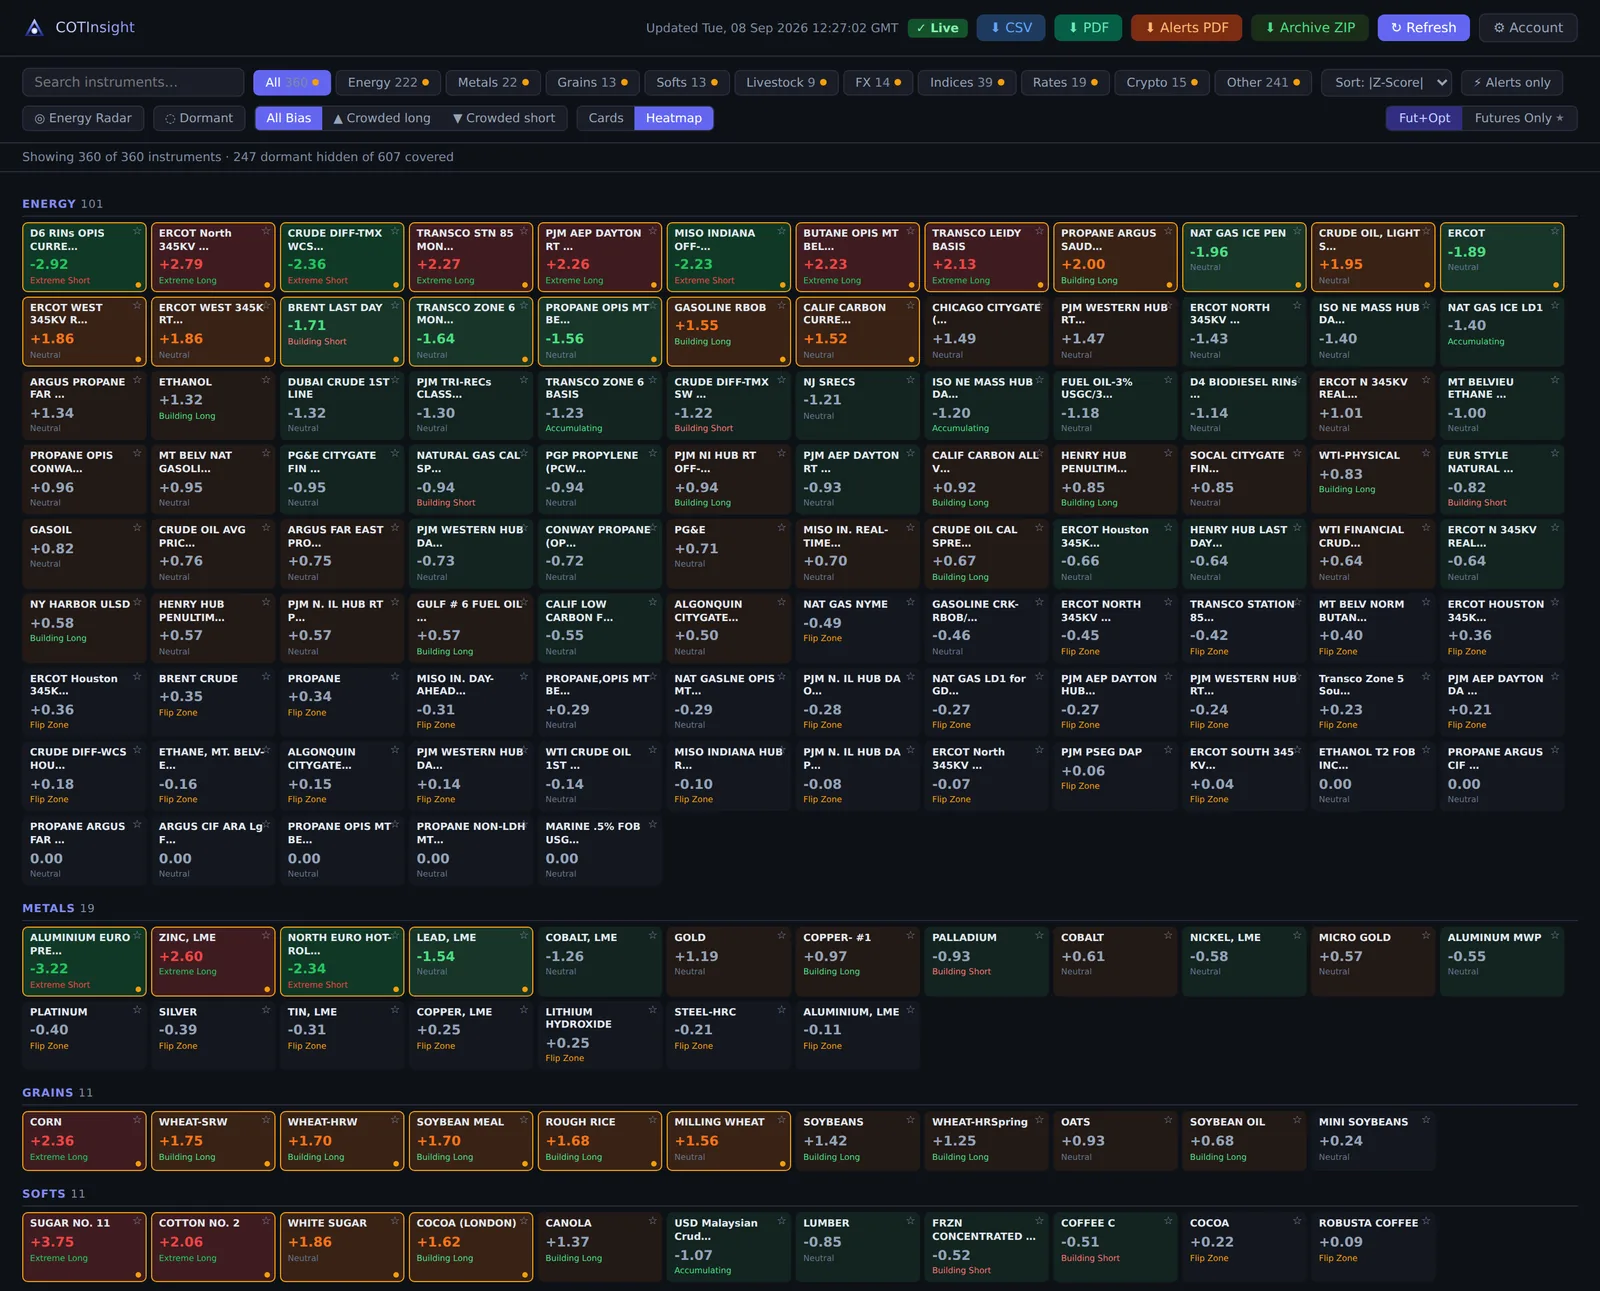
Nine layers on every market, on every paid plan. A 52-week z-score, a three-year COT Index, an eight-state regime classifier, momentum and streak, open-interest trend, price-versus-positioning divergence, small-speculator extremes, the full participant breakdown, and category concentration. Not a sampler on the cheap tier and the real thing higher up: the same nine on 100% of the book at $29.
It reads three publishers, not one. CFTC Disaggregated, Traders in Financial Futures and Supplemental, plus ICE Futures Europe and the LME, on every tier including the trial. 346 CFTC markets, 7 ICE contracts and 7 LME metals in the current board.
It shows who holds the position, not just how big it is. Positioning structure, on Ultimate, reports the exchange's own top-4 and top-8 trader concentration ranked against that contract's own history, plus the speculative trader count and average position size wherever the CFTC discloses them. Concentration percentiles are available on 349 of the 360 live markets. Why it matters: on the 1 September report corn and Chicago wheat both read a COT Index of 100, maximum crowding on the same scale, while corn's trader concentration sat in the 65.4th percentile of its own record and wheat's in the 5.1st. One crowd is held in a few large hands, the other is spread wide, and a dashboard showing only the index renders those two identically. Full detail in trader concentration in the COT report.
It is also where a gap in the data gets handled honestly. The CFTC writes a suppression marker instead of a number when too few traders hold a position to disclose the count, which covered 201 of the 360 live markets on this report. We withhold the count there and show the total reporting-trader count instead, rather than printing a zero that would read as "nobody is in this market".
It tells you what this market has done from a reading like this before. Not what markets in general do, this one. For each covered market and each z-score bucket, Ultimate shows what followed over the next 4, 8 and 12 weeks with the sample size printed beside every number. It is computed on the full record back to 13 June 2006, and covers the markets with a mapped price series and enough history behind them, which is a large minority of the book rather than all of it. The covered list is shown in the product and moves as the archive grows.
The discipline is the point. Across the markets carrying at least 25 extreme readings, measured on 8 September 2026, the four-week contrarian rate runs from 19.2% to 72.4%, with the median and the pooled rate both close to 47% on more than 2,400 observations. Platinum resolves downward from a crowded long 65.2% of the time across 66 observations. Corn does it 27.0% of the time across 63, which is to say corn's crowded longs mostly keep going. Pooled, the classic contrarian rule is a coin flip; per market it is sometimes a real edge and sometimes the opposite of one. Knowing which market you are in is worth more than any average across markets.
It counts the options. Futures and options combined across every market, with an Ultimate view of what share of open interest sits in options and how far that leg moves the read. On the 1 September report corn ran 32.0%, the E-mini S&P 32.2%, gold 28.3%, WTI 24.9% and sugar 23.8%, while natural gas ran 0.7%. That difference decides whether a headline net position is worth acting on.
It separates index money from hedgers. On the 13 agricultural markets the CFTC publishes a Supplemental report for, the index-fund position sits beside the reading along with the commercial book once index money is stripped out. On 1 September, Kansas wheat carried 28.5% of its open interest as index longs, Chicago wheat 24.9%, sugar 24.1%, lean hogs 22.6% and corn 21.9%. That is the largest single distortion in the agricultural commercial number, and the Disaggregated report cannot show it. Mechanics in index traders and the Supplemental report.
It reads positioning against the physical market. The Ultimate forward curve, on 19 contracts, tells you whether crowded length is paid to wait in backwardation or bleeding roll in contango. Energy Radar sets WTI, natural gas, gasoline and diesel positioning against the weekly EIA fundamentals: commercial stocks against their five-year seasonal band, Cushing, the SPR, production and refinery utilisation.
Energy Radar carries a published bar for saying anything directional. A relationship renders as a measured base rate only if it clears 30 independent observations and |t| ≥ 1.0; otherwise the cell renders with its sample count and no direction attached. Gasoline above its seasonal band clears it at 37 independent observations and t = +1.95. Distillate does not, at 24 and t = +2.69, and is shown descriptively. Publishing the ones that fail is the part that is hard to fake.
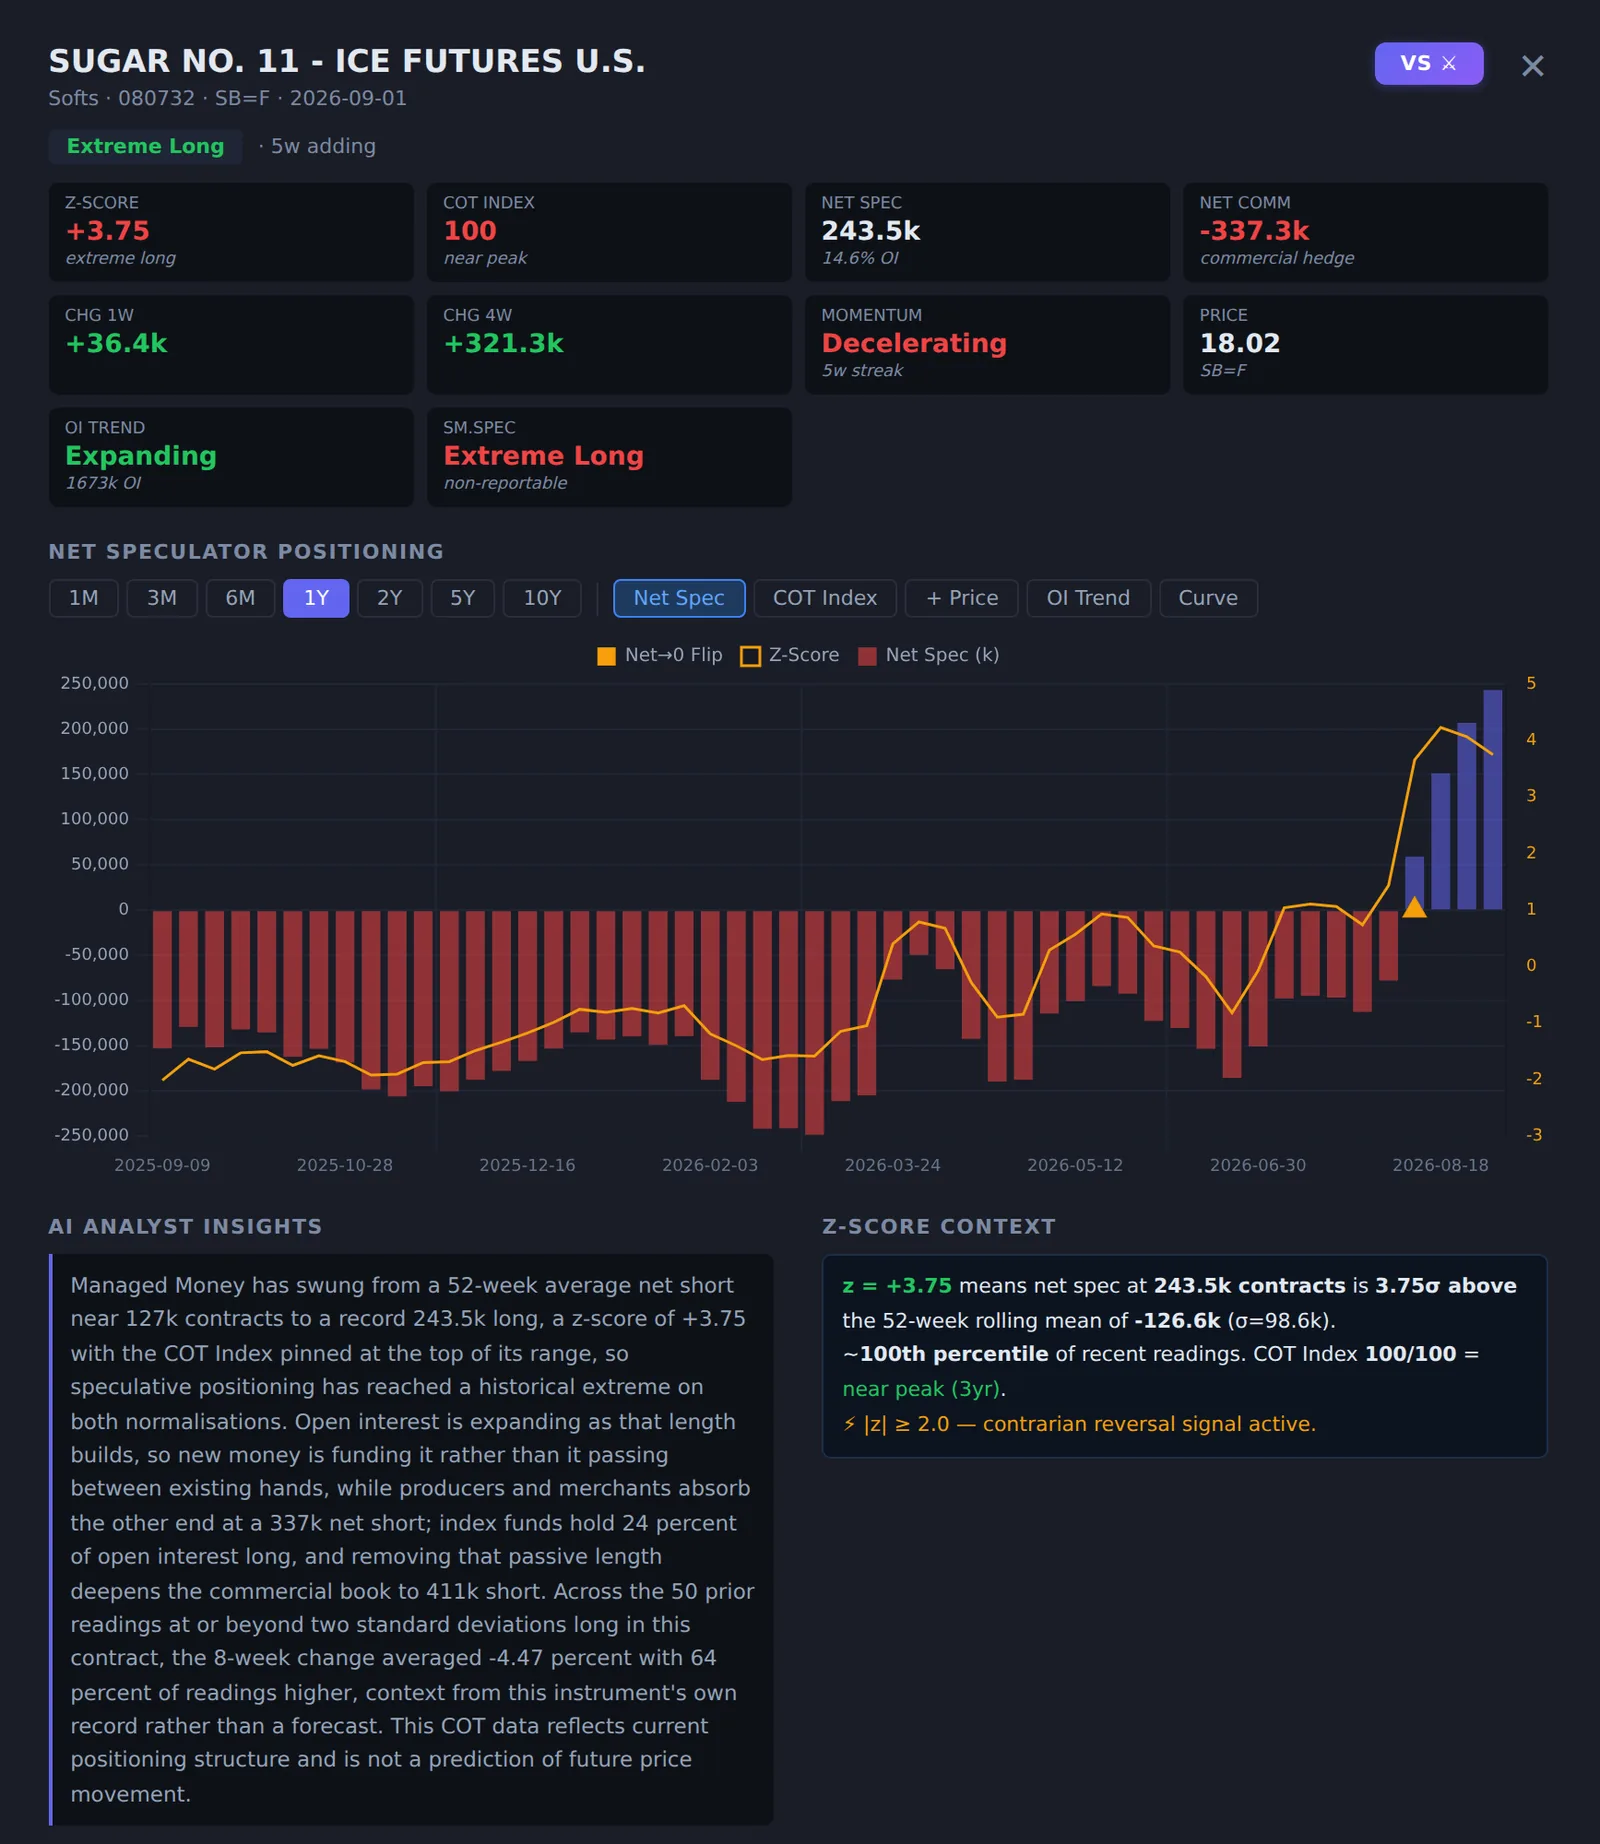
An analyst writes up every flagged market. When a market reaches a positioning extreme the AI analyst produces a written read of that specific configuration the moment the data lands: who holds the exposure, whether it is funded by new money or passed between existing hands, whether the two normalisations agree, what the hedging side is doing. Descriptive by design, it states no forecast, and it saves reconstructing the same picture by hand.
It puts the same read on your chart. The COTInsight TradingView indicator plots the z-score, COT Index and regime state on any weekly chart, across 99 chart symbols mapped to 55 CFTC markets, and is published on TradingView. It is included with Ultimate at $49. There is also a free, open-source COT Index Lite on TradingView, 96 symbols and 54 markets, which requires no subscription at all. One scope note stated plainly: TradingView publishes no COT series for ICE Futures Europe or the LME, so those books are dashboard and export only.
It compares two markets side by side. VS mode puts any two instruments and their curves on one screen, which is how a spread, a rotation or a relative-value idea actually gets checked. Gold against silver, WTI against Brent, the euro against the dollar index.
It gives you the data back, not just the picture. A REST API with a personal key on Ultimate, structured CSV exports on Pro and Ultimate, PDF briefings and the full archive as a ZIP on Ultimate. No other product here describes an API on its public pages.
Everything we know is published free. The whole guide library, from reading the report to regimes, divergence and concentration, a reference page for every market we carry and an RSS feed. No login, no email form, nothing to buy. The subscription buys the scored data, never the education.
That is the part you cannot check from the outside. Nine layers on 360 markets, three publishers, your own markets on screen in about two minutes. Seven days, full dashboard, no credit card. Start the trial.
The setting that changes the answer: which lookback your COT Index uses
Every tool here that computes a COT Index uses the same Larry Williams formula, 100 x (net - lowest net) / (highest net - lowest net), over a lookback window. What differs is the window, and the window changes the answer more than any other choice in the calculation. Not every tool tells you which one it used.
We measured it on 8 September 2026. Same Managed Money data, same CFTC report dated 1 September 2026, same formula at two windows:
| Market | 26-week Index | 156-week Index |
|---|---|---|
| Cocoa | 100.0 | 17.2 |
| Nasdaq 100 | 100.0 | 72.6 |
| British Pound | 83.4 | 60.0 |
| Gold | 82.4 | 57.7 |
| WTI Crude | 60.5 | 43.4 |
On a 26-week lookback, cocoa reads at the absolute ceiling, the most crowded long that window has ever seen. On three years the same position reads 17.2, which is closer to the floor than the ceiling. A trader acting on the first number is fading a record. A trader acting on the second may be doing the opposite. Both are reading "the COT Index".
Then we counted how often each window saturates, meaning it sits at exactly 0 or exactly 100 and has stopped conveying information. The sample is every live market we hold whose record runs from the first Disaggregated report to the present, which is 51 markets, over the entire record from 13 June 2006 to 1 September 2026:
| Window | Readings pinned at 0 or 100 | Observations | Share |
|---|---|---|---|
| 26-week | 11,192 | 50,395 | 22.2% |
| 156-week | 2,603 | 44,050 | 5.9% |
The shares hold whether the sample is the twenty largest of those markets or all fifty-one, which is why we quote them rather than a single cut. More than one reading in five from a 26-week COT Index is stuck against a boundary, against about one in seventeen at three years. Twenty-six weeks is Larry Williams' later setting, and it is the default that many indicators and spreadsheet templates carry, which means plenty of traders are on it without ever having chosen it.
Where that leaves the tools here. COTBase lets you set any lookback and any trader group. COTSignal published 52 and 156 week windows. Insider-Week shows a COT Index column and a 26-week commercial extreme. COT-Reports.com computes no index. COTInsight fixes the window at 156 weeks for the Index and 52 for the z-score, and states both on every reading.
Fixed is not automatically better than adjustable. What matters is that the number is never quoted without its window, because a COT Index reading without one is not interpretable. The full working is in COT Index explained, including what choosing 156 costs in responsiveness.
How market counts are quoted, including ours
Every tool here has to decide what counts as a market. The CFTC file carries contracts that stopped reporting years ago, and counting those produces a bigger number.
We publish two figures instead of one, and a test in our build pins the headline against what the dashboard actually shows, so the number cannot drift away from the product. On 8 September 2026 the live board held 607 instruments, of which 360 reported and were scored and 247 were dormant, some last seen in 2008. The dormant ones are kept for their history and hidden unless you ask for them. A further 15 report but carry under 52 weeks of data, so no z-score or COT Index is possible yet; they are listed separately with the week each becomes scorable rather than quietly dropped.
Nothing is double counted. The ICE contracts and the LME metals sit inside that 360, not on top of it.
We have not audited how any other product counts, so read every market count on this page, ours included, as the vendor's own claim unless you check it.
Which COT tool should you choose?
- You check three majors once a month. A free tool will show you the numbers, and that is a reasonable place to start.
- You want Legacy, Disaggregated and TFF tables at no cost. Insider-Week's tool covers all three.
- You want to set your own lookback on one market, with Legacy history back to the eighties. COTBase Premium at $19.99.
- You want an intraday chart indicator for NinjaTrader. COTBase sells two, from $99 a month. Note that they are computed by COTBase rather than derived from the CFTC report, because no intraday COT data exists.
- You need ICE Brent, gasoil, the London softs or the LME metals book. Nothing else on this page carries them. COTInsight Pro at $29.
- You want to know which of 360 markets is stretched right now, ranked on one scale, the moment the release lands. COTInsight Pro at $29.
- You want the reading to come with its own context. Who holds the crowded position and how that compares with the contract's own history. What this market did from this reading before, over 4, 8 and 12 weeks, with the sample size shown. What the options leg does to the number. What the curve says about the cost of holding it. Whether index funds are sitting inside the commercial figure. That is COTInsight Ultimate at $49.
Every tool here can tell you a market is crowded. That is the easy half, and the free ones do it perfectly well. The hard half is whose position it is, what is funding it, what it costs to hold, and whether the number is even measuring the contract you think it is. That is the half that changes what you do on Monday.
The comparison that settles it is your own. Pick the three markets you actually trade and look at them on the trial, then look at the same three weeks in whatever you use now. Seven days, full dashboard, no credit card, nothing to cancel. Start the trial or read the plans.
Where we are the wrong choice
- You want free forever. The free tools keep working at no cost, and casual monthly checking does not need a subscription. Our guides, market pages, RSS feed and weekly email are free too, and so is the COT Index Lite indicator on TradingView.
- You need something to trade off intraday. The CFTC publishes weekly, ICE publishes weekly, the LME publishes weekly, and so do we. Nobody publishes intraday positioning, because the reports do not exist at that frequency. COTBase sells intraday indicators computed by its own algorithm, which is a different product rather than a faster version of this one.
- You want a video show or a member forum. Other products in this field run webinars, coaching and communities. We put the hours into the data.
- You want outcome statistics on every market. They cover the markets with a mapped price series and enough history behind them, which is a large minority of the book rather than all of it, and the covered list grows as the archive does. On the rest you get the nine layers and no invented base rate.
What we will not tell you is that the feature list is finished. We build something new or make something existing better every week, and it arrives inside the subscription you already have, at no extra cost. If something you need is missing today, the honest answer is usually that it is on the way.
Who builds COTInsight
We are traders first. The team behind COTInsight has more than twenty years in these markets, and every layer in the product came out of a position we were sizing or a risk we were trying to see before it hit us. That is why the platform reads positioning the way a trader does, asking who is exposed, how stretched they are, what is funding them and what happened the last time the book looked like this, rather than reproducing CFTC tables in a nicer font.
Positioning is where we started, not where we stop. COT was the first dataset worth industrialising, then the London metals book, then ICE Futures Europe, then the weekly EIA energy fundamentals. The same treatment is being extended to the other datasets that move these markets. A subscription today is access to that direction of travel, not to a finished feature list.
Everything on this page is dated. Competitor tiers and pages were read on 8 September 2026; anything we could not reach that day carries its earlier reading date so you can see exactly how fresh it is. Our own figures were computed the same day from the live platform, on the CFTC report dated 1 September 2026.
How we checked, and the limits of it. Every other product here is described from its own public pages: pricing, features, FAQ and documentation. We hold no subscription to any of them, so what sits behind a login may be more than those pages show, and where we say a product does not do something we mean it was not stated on the pages we could read that day. Each company's name and product are its own trademarks; none of them is affiliated with us or has endorsed anything here. We built COTInsight, so we are not a neutral referee. We are an auditable one: every number on this page has a source you can check, ours included.
Frequently Asked Questions
What is the best COT report tool in 2026?
COTInsight, if you want the full read on every market rather than on one at a time. Every paid plan carries the same nine layers on all 360 live markets, so lean hogs gets the z-score, COT Index, regime state, divergence, open-interest trend and concentration that gold gets, and the London books no CFTC-only tool has come with it: ICE Brent, gasoil, the London softs and the LME metals. Ultimate goes deeper on each one: what that market did from a comparable reading before, who is holding the crowded position, how much of the headline is an options book, what the curve costs you to hold it, and how much of the farm commercial line is index money on autopilot. $29 a month for Pro, $49 for Ultimate, seven days free with no card. The report itself is free, and if you check three majors once a month the free routes will do: free COT tools and where they stop says which.
Which COT tool covers ICE Brent?
COTInsight. ICE Futures Europe reports to the UK FCA rather than the CFTC, so ICE Brent appears in no CFTC file, and none of the four competitor products we checked on 8 September 2026 carried it. On the 1 September 2026 report ICE Brent held 3,475,202 lots of open interest against NYMEX WTI's 2,556,627, while the NYMEX BRENT LAST DAY contract most tools label "Brent" held 310,447. See ICE Brent and the COT report.
Which COT tools include LME positioning data?
COTInsight carries the LME book for aluminium, copper, zinc, nickel, lead, tin and cobalt on every tier. That data is published by the exchange, not the CFTC, and none of the competitor products checked on 8 September 2026 carried it.
Is forty years of COT history worth paying for?
Only for long-horizon research on the coarsest version of the data. Legacy futures-only reaches 15 January 1986, but Legacy splits the market three ways, commercial, non-commercial and non-reportable, so it cannot tell a hedge fund from a swap dealer or an index fund from either. The three reports that do make that distinction, Disaggregated, Traders in Financial Futures and Supplemental, all begin on 13 June 2006, confirmed against the CFTC's own public data service on 8 September 2026. Our archive starts at that floor, so on those three families nobody can go deeper than anybody else. The readings traders actually quote are built on one to three years, which means the extra decades change nothing about this Friday's number. The comparison worth making is not depth against breadth: it is an adjustable lookback on one market at a time against the same nine layers on all 360 markets, three publishers instead of one, and the London books that appear in no CFTC file.
How much does a COT report subscription cost?
Checked on 8 September 2026: COTBase Premium $19.99 a month and its Pro tier $99, with two chart indicators listed separately at $99 and $149. COTInsight Pro $29 and Ultimate $49, or $24 and $41 on annual billing. COTSignal, Insider-Week's tool and COT-Reports.com are free. Prices change and COTBase's indicator price differs between its own two pages, so check each vendor's page before deciding.
Which COT tools show trader counts and concentration?
The CFTC publishes trader counts and top-4 and top-8 concentration every week and almost no tool surfaces them. COTInsight Ultimate reports concentration ranked against each contract's own history on 349 of the 360 live markets, plus the speculative trader count wherever the CFTC discloses it. On the 1 September 2026 report corn and Chicago wheat both read a COT Index of 100 while their concentration percentiles were 65.4 and 5.1. See trader concentration in the COT report.
Do any COT tools offer an API?
COTInsight publishes a REST API with a personal key on the Ultimate tier, serving the scored series rather than raw report columns. The CFTC's own public data service is free and needs no key, but serves raw report columns only. We found no published API on the pricing, feature or FAQ pages of the other products on this page as read on 8 September 2026.
How far back does COT history actually go?
Legacy futures-only reaches 15 January 1986. The Disaggregated, Traders in Financial Futures and Supplemental reports all begin 13 June 2006, confirmed against the CFTC's own public data service on 8 September 2026. A tool advertising forty years of history is advertising the coarser three-category Legacy measurement, since the trader categories most people want did not exist in the data before 2006.