Free COT Report Tools: TradingView, Barchart, Investing.com and the CFTC's Own Files
Short answer. The COT report is free. The CFTC publishes it every Friday, anyone can read it, and the free tools put it on screen in a readable format. Every one of them shows you the same public file the CFTC already gives away. A couple compute one measure on top of it, and that is where their work stops, so the free route hands you a position and leaves almost all of the interpretation to you.
That is the part that matters, because the interpretation is the job. Is 240,000 net long a lot for this market, or an ordinary Tuesday? Is it more stretched than the other eleven markets you follow? Has this market ever unwound from here, and what happened when it did? A nicer table answers none of those questions, and neither does the raw file behind it.
There are two more gaps that are easy to miss, and one of them is not about effort at all.
The biggest oil contract in the world is not in the CFTC report. ICE Brent is regulated in London, not Washington, so it appears in no CFTC file and therefore in none of the free tools below. On the report of 1 September 2026 it carried 3,475,202 lots of open interest against NYMEX WTI's 2,556,627. What most tools label "Brent" is a smaller New York look-alike holding 310,447 lots, under a tenth the size, and on that day the two told opposite stories. ICE does publish that report, free, on its own site. What no free tool on this page does is fetch it, so closing the gap is a second collection job rather than a setting you can change. Details below.
And where a free tool does give you a percentage, the setting behind it decides the answer. Same cocoa position on the same report reads 100 out of 100 on one common setting and 17 out of 100 on another. Most tools do not tell you which one they used. More on that below, because it is the thing most likely to cost you money on this page.
The free routes, and where each one stops
| Free route | What you get | Where it stops |
|---|---|---|
| The CFTC's own files | The original source, complete, free, published every Friday | A wall of raw numbers with no ranking, no percentile and no context |
| Tradingster | Clean tables for 323 markets, no login (read 19 Aug 2026) | One market per page, and nothing tells you whether a reading is extreme |
| Barchart | Charts and a commercial index on 55 markets (read 19 Aug 2026) | Its own page says members see the last 52 weeks, which is too short for a three-year reading |
| TradingView | Official COT indicators on the chart you already use | One number per indicator slot, and the free plan allows two |
| Investing.com | A single speculative figure in the calendar | No breakdown by trader type, so it is a headline, not a dataset |
| ICE's and the LME's own files | Free positioning reports straight from both London publishers: one ICE CSV per year, one LME spreadsheet per metal per week | No tool on this page carries either, and neither file uses the CFTC's schema |
Curious what the context looks like? COTInsight scores 360 markets the moment the data lands. 7 days free, full access, no credit card. Start the trial.
The CFTC's own files
This is where every tool on this page gets its data, and where you can get it too. It is free, complete and published every Friday afternoon.
It is also a raw file. You get positions and nothing else: no percentile, no ranking, no label telling you that this week's number is the highest in three years. Turning it into something you can act on is a spreadsheet project that starts again every Friday, and the file formats do not match each other between report types, so the project is bigger than it looks on the first weekend.
This is the honest baseline for the whole page: every free tool below starts from this same file.
Tradingster
Readable tables of the same public file: positions, weekly changes and percentage of open interest, with no login. It covered 323 markets when we read it on 19 August 2026.
Where it stops: one market per page, and no measure of whether a reading is stretched. If you are looking for a Tradingster alternative, it is nearly always because you want to compare markets against each other rather than read them one at a time.
Barchart
Charts on 55 markets and one computed measure, an index on the commercial position. That is more than most free tools attempt, and it is still a single number on a single group of traders.
Where it stops: its own page states that members page through the last 52 weeks. That is one year, and the standard reading everybody quotes is built on three. Read 19 August 2026.
TradingView
The official COT indicators put report data under your price action, which is where most people want it if they follow a handful of markets.
Where it stops: each indicator returns one number, so watching long, short, commercial net and open interest on a single market uses four of your slots, against a limit of two on the free plan.
There is a way around part of that, and it costs nothing: we publish a free, open-source COT Index Lite covering 96 chart symbols across 54 markets, which puts a normalised reading on the chart in one slot. No account with us required. The paid version adds two more panels. Neither can show you Brent or the London metals, because TradingView carries no positioning data for those exchanges.
Investing.com and the news portals
One speculative number per release inside the economic calendar. Useful for knowing the report came out. Not a positioning dataset, and not something to build a view on.
ICE and the LME, free at the source
Worth stating plainly, because no tool above carries these markets and it is easy to conclude the data does not exist: both London publishers give their positioning reports away.
ICE publishes a Commitments of Traders file in its public Report Center, one CSV per calendar year, no login and no payment. Read on 8 September 2026, the current year's file held every weekly report of the year so far across seven contracts, each in futures-only and futures-and-options form. The yearly files run back to 2011.
The LME publishes a weekly commitment-of-traders report per metal, one small spreadsheet on each metal's page, with years of back copies beside it. Also free, also no login.
So the gap is not that the data is locked away. It is what sits between those files and a reading:
- Neither file is built like the CFTC's. ICE dates its rows its own way and carries none of the CFTC's contract codes. The LME splits traders into European regulatory categories that do not line up one-for-one with the CFTC's commercial and non-commercial, so putting an LME reading beside a COMEX one is a judgement call before it is a calculation.
- The LME arrives one metal at a time, one week at a time, and its site blocks automated downloads, so building the back series is a project rather than a script.
- Nothing here is normalised either. Both are raw position counts, exactly like the CFTC file, so everything in the next section applies to them too.
That is real work rather than a locked door, and it may be why the aggregators stop at the CFTC.
The honest shortcomings of the free tools
Mostly they reformat rather than add. Every free tool on this page reads the same public CFTC file, and a cleaner table is genuinely easier to read than the raw one. Two of them go further and compute something: Barchart publishes an index on the commercial position, and TradingView's indicators put report columns on a chart. Even then it is one measure, on one group of traders, over a lookback window that is not always stated. That is the ceiling of what the free route adds.
They cannot tell you whether a number is unusual. A net long of 240,000 means nothing until you know where it sits against the last year and the last three years, for that market and that group of traders. The free tools give you the number and stop. The context is the entire product.
They cannot rank one market against another. If your Friday question is "which of the markets I follow is the most stretched right now", no free route answers it on one screen. You are reading one page at a time and holding the comparison in your head, which is exactly where comparisons go wrong.
They have no memory. The report lands, and the same work starts again. A free tool shows you this week and never builds a running record of where each market has been, so the question "has this market been here before" cannot be asked, let alone answered.
They cannot tell you what a reading like this has produced before. This is the largest gap on the list. None of the free routes on this page publishes, for any market, what followed the last time that market sat where it sits now. What you are left with is a rule of thumb borrowed from markets in general, and that rule is a good deal weaker than it sounds. The measured numbers are further down this page.
Dead markets look exactly like live ones. The official file still carries contracts that stopped trading years ago and nothing marks them. We checked our own book on 8 September 2026: of 607 instruments we hold, 247 are dormant, some last seen in 2008, and 360 are actually reporting. Nothing in the free data separates those two piles for you, and any statistic you compute across the whole file is quietly wrong because of it.
Some of the market is in two other files entirely. Brent, gasoil, London cocoa, robusta coffee and white sugar are published by ICE in London, not by the CFTC, and so are the LME metals: aluminium, copper, zinc, nickel, lead, tin and cobalt. Both publishers give those reports away, as set out above, but no tool on this page carries either, so on the free route you are running a second and a third collection job yourself. If you trade Brent and read a CFTC "Brent" number, you are reading a different contract with under a tenth of the money in it. The detail is in ICE Brent and the COT report.
The setting that quietly changes your answer
This is the one that looks like the free route working, because a number appears and it is in a sensible range.
The popular 0 to 100 positioning reading is a simple idea: where does this week sit between the highest and lowest of the recent past? The catch is the phrase "the recent past". Look back six months and you get one answer. Look back three years and you get another. Same market, same week, same maths.
Here is what that looked like on the report of 1 September 2026:
| Market | Six-month setting | Three-year setting |
|---|---|---|
| Cocoa | 100 | 17 |
| Nasdaq 100 | 100 | 73 |
| British Pound | 83 | 60 |
| Gold | 82 | 58 |
| WTI Crude | 61 | 43 |
Cocoa on the short setting is at the absolute ceiling, the most crowded that window has ever seen, and on the longer one it is nearer the floor. A trader acting on the first is fading a record. A trader acting on the second is doing something else entirely. Both would say they were reading "the COT index".
It gets worse for the short setting. When the reading sits at exactly 0 or exactly 100 it has run out of room and stopped telling you anything beyond "at least as extreme as recently". We measured how often that happens across every market we hold with a complete record since 2006: on the six-month setting more than one reading in five is stuck at a boundary, and on the three-year setting about one in seventeen.
So a short window manufactures extremes, especially after a quiet stretch, which is exactly when you are most likely to believe one. This is not an argument that free tools are wrong. The good ones publish their setting, and if yours does, take it seriously. It is an argument that a positioning percentage quoted without its window is not worth acting on, and that if you have never checked which one yours uses, that is the single most valuable thing you can go and do today. We use three years and say so on every reading. The reasoning is in COT index explained.
What paying for it actually buys
Everything below was measured on 8 September 2026 from the live platform.
The whole board, already scored. 360 markets, ranked on one scale, the moment the new report lands. That is the Friday afternoon back.
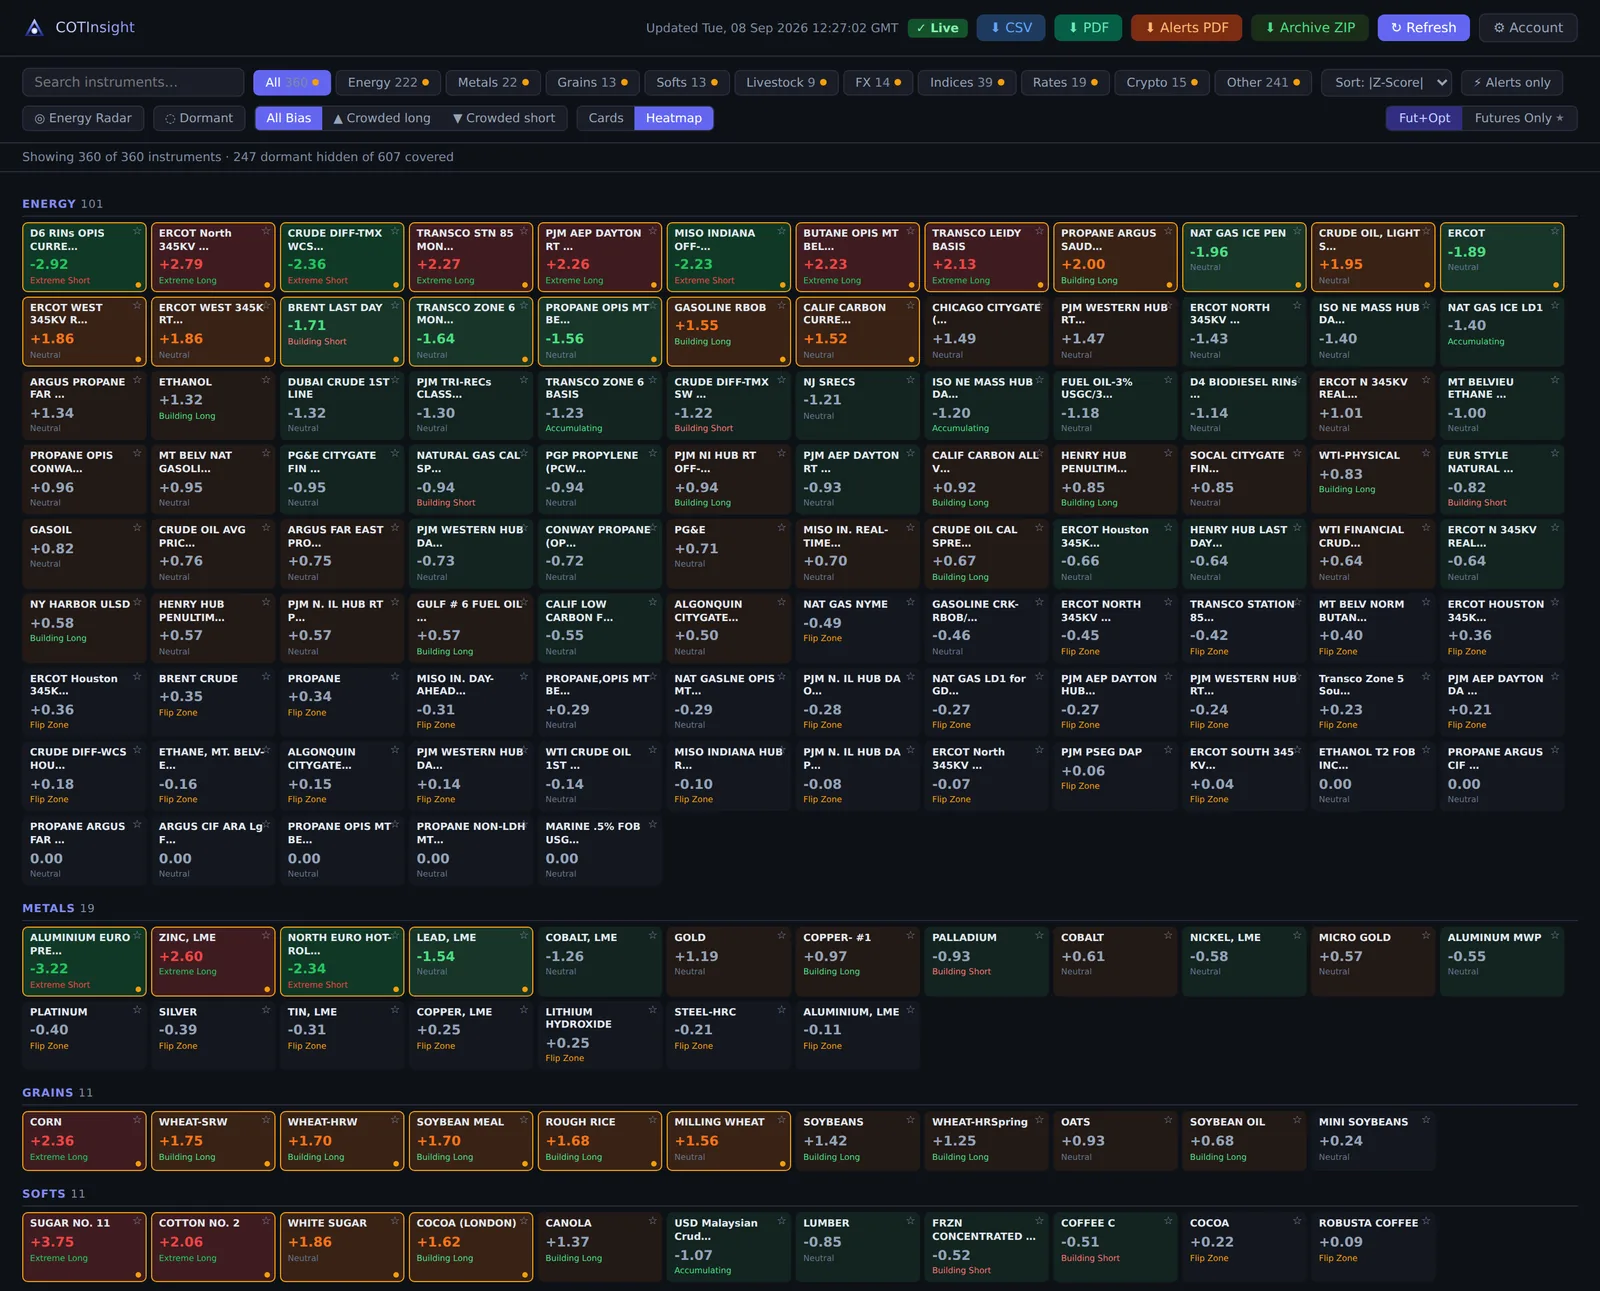
Every market normalised. Lean hogs and the euro sit on the same scale, so "which is stretched" becomes something you sort by rather than something you estimate. Nine readings on every market, on every paid plan, including regime state, divergence between price and positioning and open interest trend.
Brent, gasoil, the London softs and the LME metals, on every plan including the free trial. The publishers give those files away and we say where to get them above. What you are paying for is that they arrive parsed, mapped onto the same scale as the CFTC markets and ranked beside them, rather than as a year of CSV and one spreadsheet per metal per week going back years.
Who is holding the crowded position, not just how big it is. On 1 September, corn and Chicago wheat both hit maximum crowding on the same scale. Corn's position sat in a fairly ordinary number of hands for corn, and wheat's was spread about as wide as wheat ever gets. Same headline, two completely different risks, and a dashboard showing only the headline renders them identically. See trader concentration.
Index funds pulled out of the farm numbers. On the agricultural markets a large slice of what looks like hedging is index money on autopilot. On 1 September that was 28.5% of open interest in Kansas wheat, 24.9% in Chicago wheat, 24.1% in sugar and 21.9% in corn. Read the raw commercial line without that split and you are reading roll flow as though it were a view. Worked through in index traders and the Supplemental report.
The options counted. On that report, options were 32% of open interest in corn and in the E-mini S&P, 28% in gold and 25% in WTI, and under 1% in natural gas. In the heavy ones, the headline number is partly an options book, and that decides whether it is worth acting on at all.
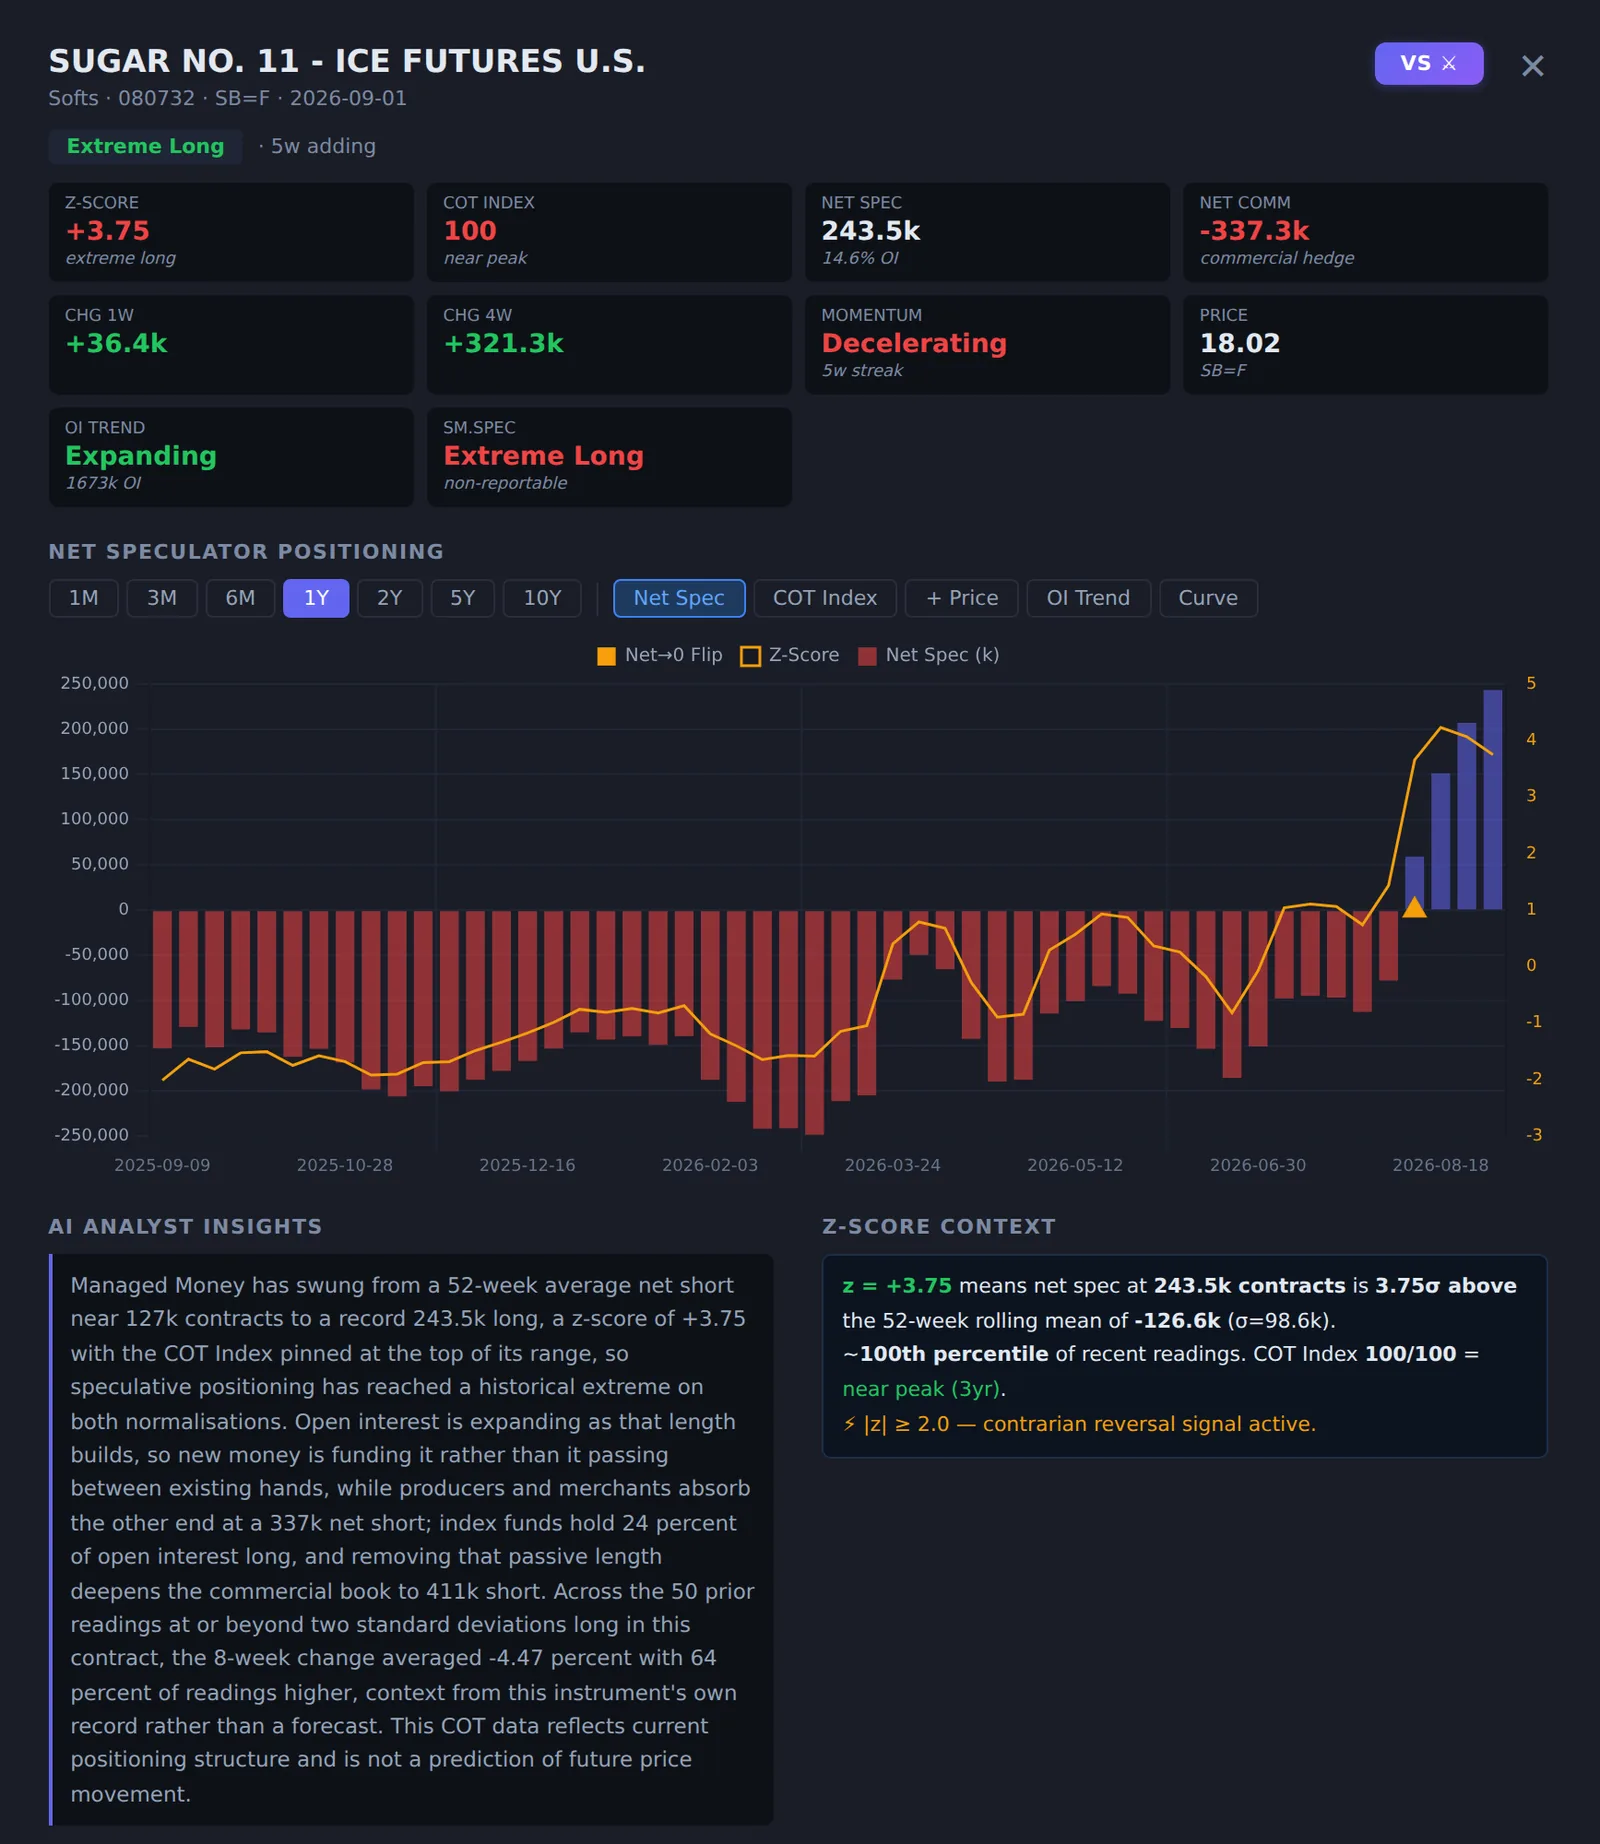
What this market has done from here before. Not what markets do in general. For each covered market, Ultimate shows what followed at four, eight and twelve weeks from comparable readings, with the number of past examples printed beside every figure so you can see when it is too thin to lean on.
That last one is also where we tell you something uncomfortable. Across the markets carrying enough extreme readings to measure, the classic "fade the crowd" rule wins about 47% of the time over four weeks, on both the median and the pooled count, which is a coin flip. It ranges from 19% to 72% depending on the market: platinum resolves downward from a crowded long 65% of the time, corn 27%. The average is useless. Which market you are in is everything, and that is the number we publish rather than the flattering one.
And the explaining stays free. The whole guide library, a reference page for every market we carry, and a weekly email. No login, no address to hand over, nothing to buy. The subscription buys the scored data. It never buys the education.
The paid products are compared against each other in best COT report tools compared.
What the free route costs you, in one sentence
You end up doing the interpretation yourself, every Friday, on a subset of the market, with no record of what came before and no way to check your rule of thumb against the market you are actually in.
That is not a criticism of the free tools. They do what they set out to do, and they do it at no cost. It is a statement about where the line sits: they present the CFTC's file, and everything past presenting it is left to you.
Two limits apply whichever route you take, and no subscription lifts either. The report describes Tuesday and is published Friday, so nothing is faster than the data itself, and anyone offering intraday positioning is selling their own calculation rather than the report. And positioning is not a timing tool: a crowded market can stay crowded for months, so it tells you where the risk is concentrated and never when the unwind starts.
We built COTInsight, so read this page as a vendor's account rather than a neutral one. Every figure on it is dated and sourced so you can check it yourself, which is the most we can offer in place of neutrality.
The only comparison that settles it is your own. Take three markets you already know well and read them on the trial, then read the same weeks however you read them now. Seven days, full access, no credit card, nothing to cancel. Start the trial or compare Pro and Ultimate.
Where the free route ends and this one starts
The free tools stop at the point where the reading needs context. Everything from there on is what you are paying for.
$29 a month puts 360 markets on one scale, ranked and ready when the report lands, including the Brent, gasoil, London softs and LME metals that no free tool carries.
$49 a month adds who is holding the crowded position, the options counted out of the headline number, the curve read against it, index money separated from the farm hedgers, and each market's own record behind the reading rather than a rule of thumb borrowed from other markets.
The first seven days cost nothing either way, and there is no card to enter, so the comparison does not have to be taken on trust.
Run the weeks you already know: gold, crude oil, Brent, the S&P 500, EUR/USD.
Start the free trial or compare Pro and Ultimate.
Every observation on this page carries the date it was made, so you can re-check any of it yourself.
Every service named here is that company's own product and trademark, and none of them is affiliated with us or has endorsed anything on this page. What we describe is what their public pages showed on the date given: we hold no subscription to any of them, so anything behind a login may differ, and all of them can change coverage, pricing and access at any time. Each observation is dated so you can re-check it. Our own figures were measured on 8 September 2026, on the CFTC and ICE reports dated 1 September 2026.
Frequently Asked Questions
Is the COT report free?
Yes, entirely. The CFTC publishes the Commitments of Traders report every Friday afternoon and anyone can read it at no cost. What you pay a tool for is never the data. It is the context: whether this week's number is unusual for this market, how it ranks against everything else you follow, and what has happened from readings like it before.
What is the best free COT report tool?
They separate mainly by format rather than by capability, because they read the same public file. Tradingster renders tables for one market at a time, Barchart adds one computed index on the commercial position, TradingView's official indicators put raw report columns on a chart, and the CFTC's own site holds the complete original record. Our free COT Index Lite is the one free route that puts a normalised reading on the chart instead of a raw column. What none of them does is rank markets against each other, show what a reading like this produced before, or carry Brent, gasoil, the London softs and the LME metals, which appear in no CFTC file.
Can I get free COT data for Brent or the LME metals?
Yes, from the exchanges themselves. ICE publishes a Commitments of Traders CSV in its public Report Center, one file per year back to 2011, and the LME publishes a weekly MiFID report per metal on that metal's page. Both are free and neither needs a login. What does not exist is a free tool that carries them: every free route on this page reads the CFTC and only the CFTC, so the collecting, the parsing and the mapping onto a CFTC-comparable scale are yours to do. COTInsight carries seven ICE contracts and seven LME metals on every plan, including the free trial.
What does a paid COT tool give me that a free one does not?
Interpretation. The free tools display the CFTC's file; a paid one turns it into a reading you can act on. Concretely: every market normalised so they can be ranked against each other, a record of what this specific market has done from a comparable reading before, who is holding the crowded position rather than only how large it is, index money separated out of the agricultural hedging numbers, and the London markets that appear in no CFTC file. Seven days free with no card is there so you can see the difference on your own markets rather than take our word for it.
Why do two COT tools show different readings for the same market?
Usually because they are measuring against different lengths of history. The same cocoa position read 100 out of 100 on a six-month window and 17 on a three-year one on the report of 1 September 2026. Nothing about the market changed between those two numbers. Find out which window your tool uses; if it will not tell you, that is worth knowing too.
Does the COT report predict price?
Not reliably, and be careful with anyone who says otherwise. Measured on 8 September 2026 across the markets in our archive carrying at least 25 extreme readings, the classic contrarian read wins about 47% of the time over four weeks, ranging from 19% to 72% depending on the market. It is a map of where risk is concentrated, not a forecast, and the per-market spread is the useful part.
Where can I learn to read the COT report for free?
Here, without handing over an email address. The library covers the report itself, how to normalise it with the COT Index and the z-score, positioning regimes, divergence, open interest, who holds the crowded positions, index money in the farm markets and the forward curve, with a reference page for every market we carry. It grows every week.